4.6 The same test, viewed as an interval
Unit 3 built confidence intervals; this unit builds tests. Are they two methods, or one?
We now have two procedures that use the same sample, the same standard error and the same critical value. It would be strange if they were unrelated, and they are not.
Start by computing the interval for our students, exactly as in the previous unit.
#> [1] 165.4 170.6The 95% interval is \([165.39,\ 170.61]\). The claimed value of 165 lies outside it — the same verdict the test reached, and not a coincidence.
The reason is visible in the algebra. We fail to reject \(H_0\) when the test statistic is small enough, that is when
\[\left|\frac{\bar{x} - \mu_0}{\sigma/\sqrt{n}}\right| \le z_{\alpha/2}\]
Multiplying through by \(\sigma/\sqrt{n}\) and rearranging for \(\mu_0\) gives
\[\bar{x} - z_{\alpha/2}\frac{\sigma}{\sqrt{n}} \;\le\; \mu_0 \;\leq\; \bar{x} + z_{\alpha/2}\frac{\sigma}{\sqrt{n}}\]
which is the confidence interval.
A confidence interval and a hypothesis test are the same inequality, solved for different unknowns.
The test fixes \(\mu_0\) and asks which sample means are acceptable. The interval fixes \(\bar{x}\) and asks which values of \(\mu_0\) are acceptable.
Testing every possible claim at once
That equivalence can be checked rather than taken on trust. Rather than testing the single claim \(\mu_0 = 165\), test every value on a fine grid and collect the ones that survive.
se  <- 8 / sqrt(36)
grid <- seq(160, 176, by = 0.001)

not_rejected <- grid[abs(xbar - grid) / se <= qnorm(0.975)]

surviving <- range(not_rejected)
interval  <- xbar + c(-1, 1) * qnorm(0.975) * se

rbind(claims_that_survive_the_test = surviving,
      confidence_interval          = interval,
      difference                   = surviving - interval)
#> [,1] [,2]
#> claims_that_survive_the_test 165.3870000 170.6130000
#> confidence_interval 165.3867147 170.6132853
#> difference 0.0002853 -0.0002853The two agree to within a thousandth of a centimetre, which is the spacing of the grid — test a finer grid and the discrepancy shrinks with it. The set of claims a test would not reject is the confidence interval. Nothing was assumed to make this happen; it follows from the two being one inequality solved for different unknowns.
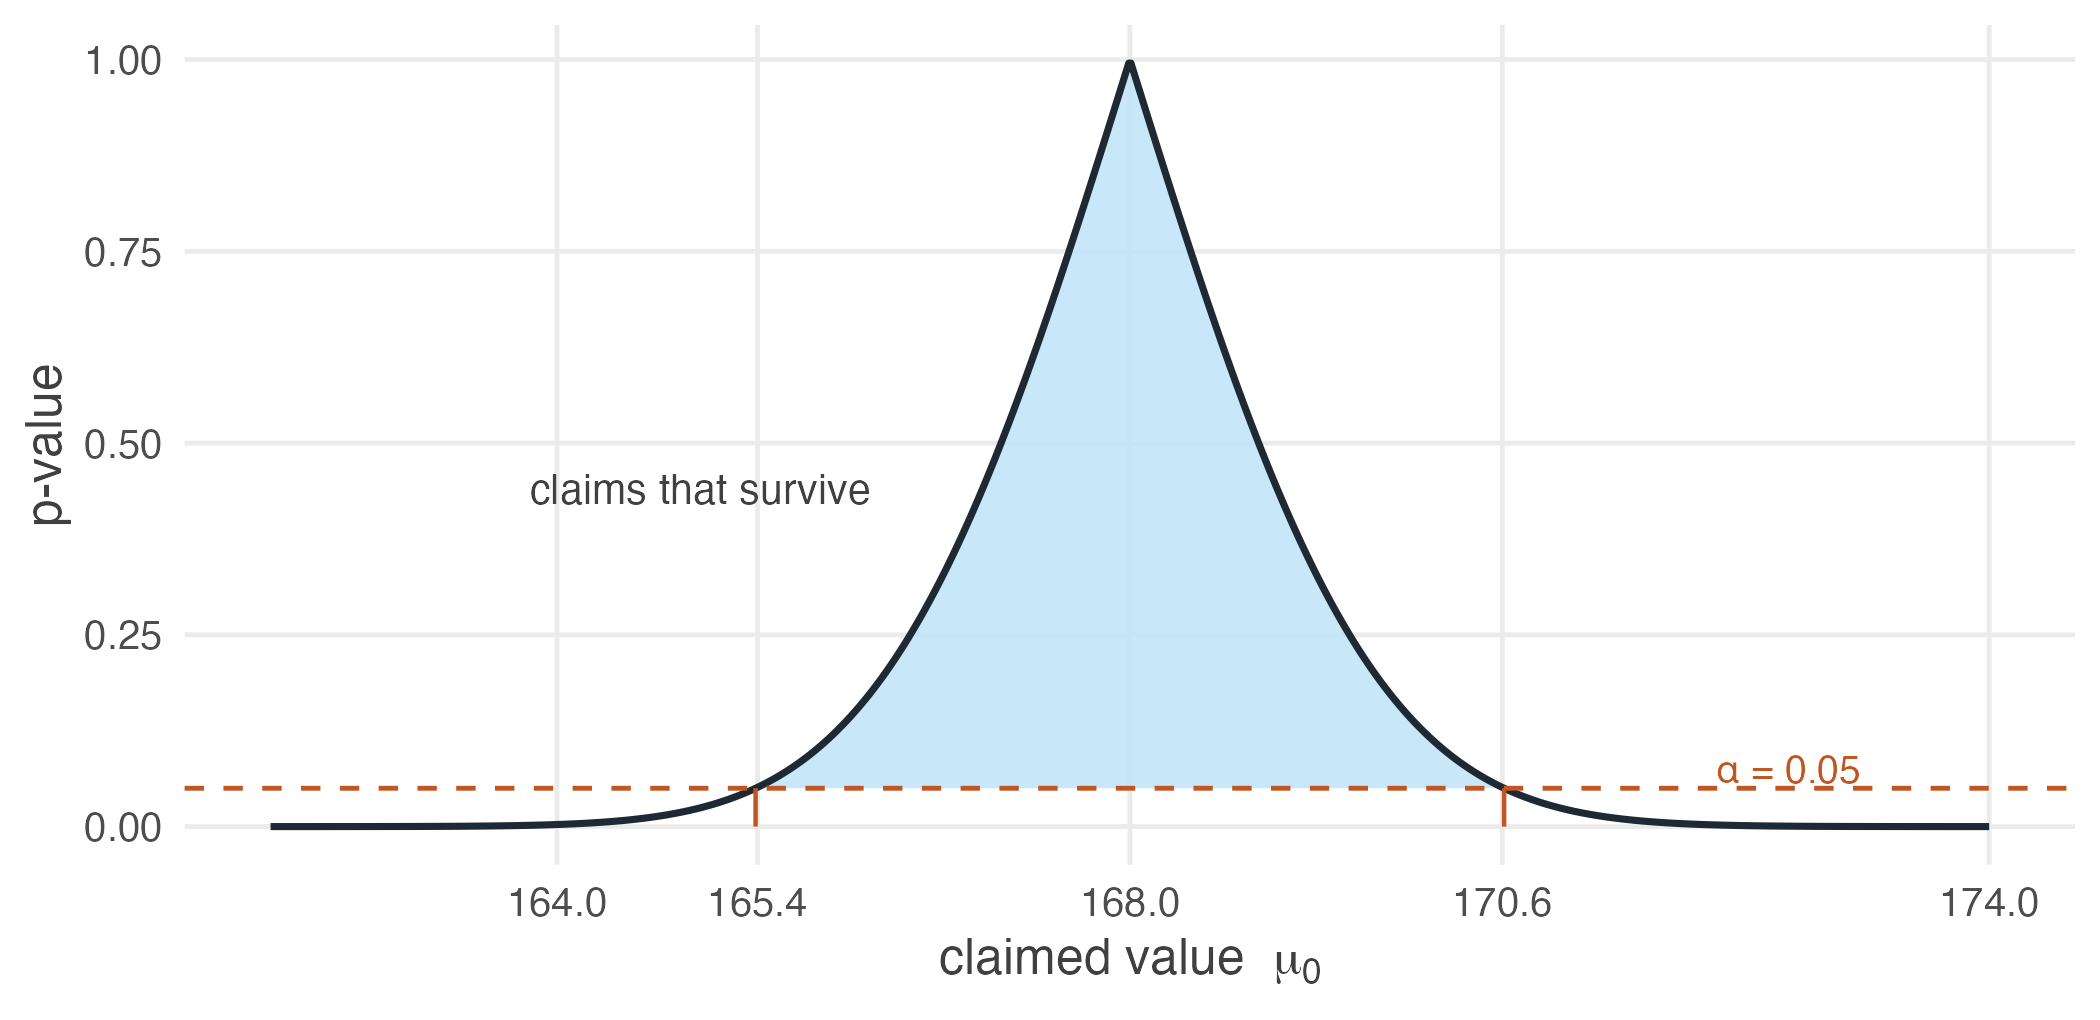
Figure 4.3: The p-value for every possible claimed value of mu. Claims above the 0.05 line survive the test, and the range of surviving claims is exactly the 95% confidence interval.
The curve reaches its maximum at \(\mu_0 = \bar{x} = 168\), and it is worth being clear about why the \(p\)-value is exactly 1 there.
A \(p\)-value asks how often a sample would fall at least as far from the claim as ours did. If the claim is our sample mean, then our sample sits at distance zero from it — and every conceivable sample is at least that far away. The proportion is therefore 1. A claim that matches the data exactly leaves nothing to explain.
As the claimed mean moves away from the observed mean in either direction, the sample becomes increasingly surprising under that claim, and the \(p\)-value falls steadily — crossing 0.05 precisely at the two endpoints of the interval.
A \((1-\alpha)\) confidence interval is exactly the set of values \(\mu_0\) that a two-tailed test at level \(\alpha\) would fail to reject.
Test and interval are one object viewed from two sides. If the interval misses the claimed value, the test rejects it. Always.
So why keep both?
Because they carry different information, and the figure above shows what each one throws away.
A confidence interval answers infinitely many tests at once, and reports the answer in the units of the problem. Handed \([165.39,\ 170.61]\), a reader can evaluate any claim about average height — 165, 166, 172 — without recomputing anything. A test answers one question, chosen in advance.
This is why confidence intervals are generally preferred in scientific papers. A single interval communicates the estimate, its uncertainty, and the outcome of every two-sided hypothesis test at that significance level, all at once.
A test, however, reports how strongly. Both 165 and 160 fall outside our interval, and the interval says the same thing about each: not plausible. The \(p\)-values do not agree — 0.024 for 165, and effectively zero for 160. One claim is marginally implausible; the other is not remotely survivable.
Put precisely: the interval tells us which claims remain plausible, and the \(p\)-value tells us how strongly the data disagree with one particular claim.
Report the interval. It contains the test, states its answer in the units the reader cares about, and does not tempt anyone into treating a single threshold as a verdict.
Report the \(p\)-value alongside it when one specific claim is genuinely at issue, since that is where the interval is silent about degree.
Everything Section 3.8 said about reading a confidence interval applies unchanged here. In particular, the 95% still describes the procedure and not this interval, and an interval that excludes a claimed value has not proved the claim false — it has reported that the data are unlikely under it.