1.1 Randomness and variation
Where does the uncertainty come from?
The uncertainty that surrounds every statistical estimate has a single source: randomness.
If we were to repeat the same study with a different sample, we would almost certainly obtain a different average. Inferential statistics is concerned with understanding this variability. Without randomness, every sample would be identical, every estimate would equal the population value, and there would be no uncertainty to quantify.
The idea is easiest to see with a die.
Suppose we roll a fair die once.
#> [1] 1The outcome is a one. Beyond that, there is little to say. A single observation tells us almost nothing about the process that generated it. Was the die fair? Would the next roll also be a one? Is one an unusually common outcome? One observation cannot answer these questions.
Now imagine repeating the experiment ten thousand times.
#> rolls
#>     1     2     3     4     5     6
#> 0.169 0.162 0.160 0.170 0.173 0.166
Each individual roll remains unpredictable, but something remarkable happens collectively. The outcomes no longer appear as isolated events. They form a stable pattern. Every face occurs with almost the same frequency, close to one-sixth of the time, exactly as we would expect from a fair die.
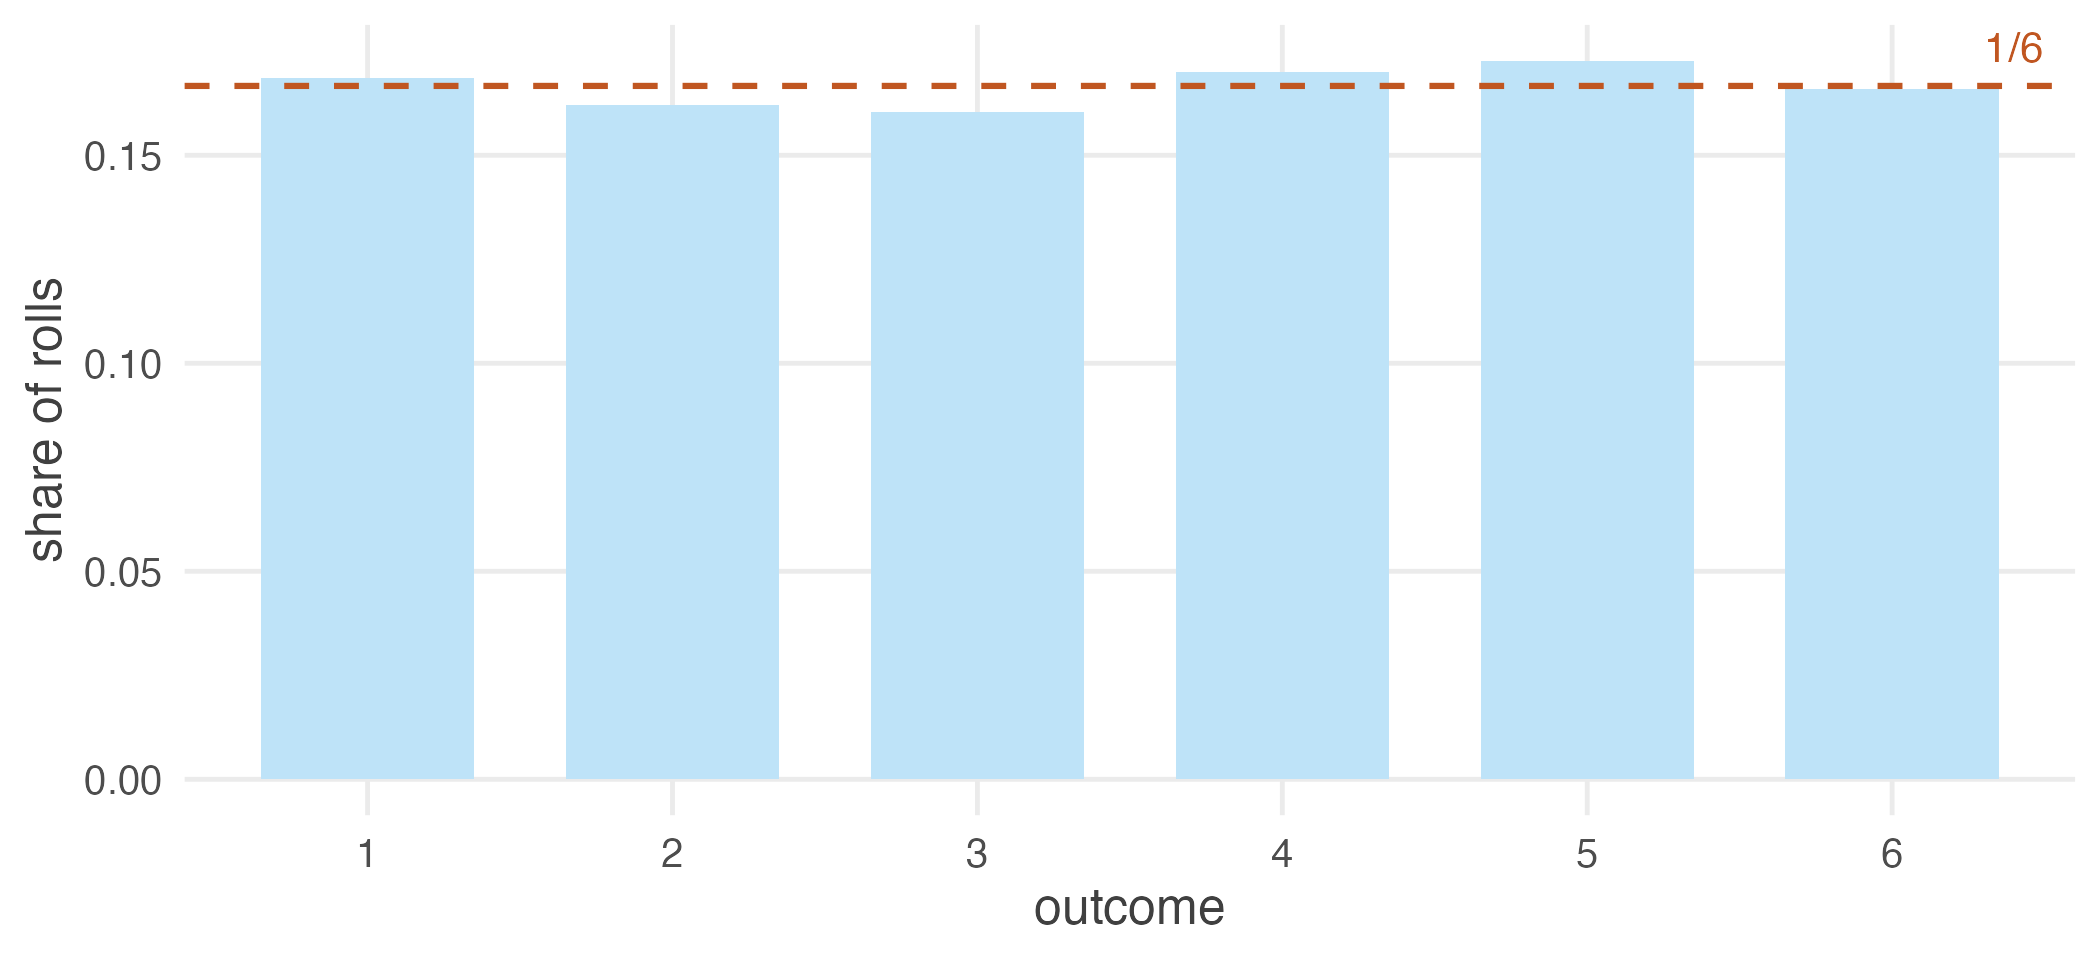
Figure 1.1: Ten thousand rolls of a fair die. No single roll was predictable. The pattern across all of them is.
The important point is not that the die turned out to be fair. It is that a pattern exists at all.
To see why that matters, imagine removing the randomness altogether. Suppose every face of the die is labelled three.
#> loaded
#>     3
#> 10000#> [1] 0Every roll now produces exactly the same outcome. There is no variation, no uncertainty and no pattern waiting to emerge through repetition. The average is always three. The standard deviation is zero. Repeating the experiment a million times teaches us nothing that we did not already know after the first roll.
The contrast between the two dice illustrates a fundamental idea. Randomness makes individual outcomes unpredictable, but repeated observations reveal stable patterns. Statistics is built on this coexistence of uncertainty and regularity. If outcomes never varied, there would be no need for inference; if they varied without any underlying regularity, inference would be impossible.
Dice provide a simple illustration, but the same principle governs every empirical investigation. Household surveys interview different families. Election polls reach different voters. Clinical trials recruit different patients. Agricultural experiments observe different harvests. Every study could have produced a different dataset. The central challenge of inferential statistics is to understand what can be learned from one realisation of a process that could have produced many others.