1.3 The limits of descriptive statistics
How far can description take us?
Descriptive statistics tells us everything we could want to know about the data we have. The difficulty is that the data we have are rarely the data we ultimately care about.
The twenty thousand workers in our dataset were not selected individually because they were special. They are one sample drawn from a much larger population of Indian workers. Had a different set of workers been surveyed, the dataset would have been different — and so too would the summaries we calculated in the previous section.
To see this, let us treat our dataset as the population and repeatedly draw samples of two thousand workers.
set.seed(1)

s1 <- workers$annual_earnings[sample(nrow(workers), 2000)]
s2 <- workers$annual_earnings[sample(nrow(workers), 2000)]
s3 <- workers$annual_earnings[sample(nrow(workers), 2000)]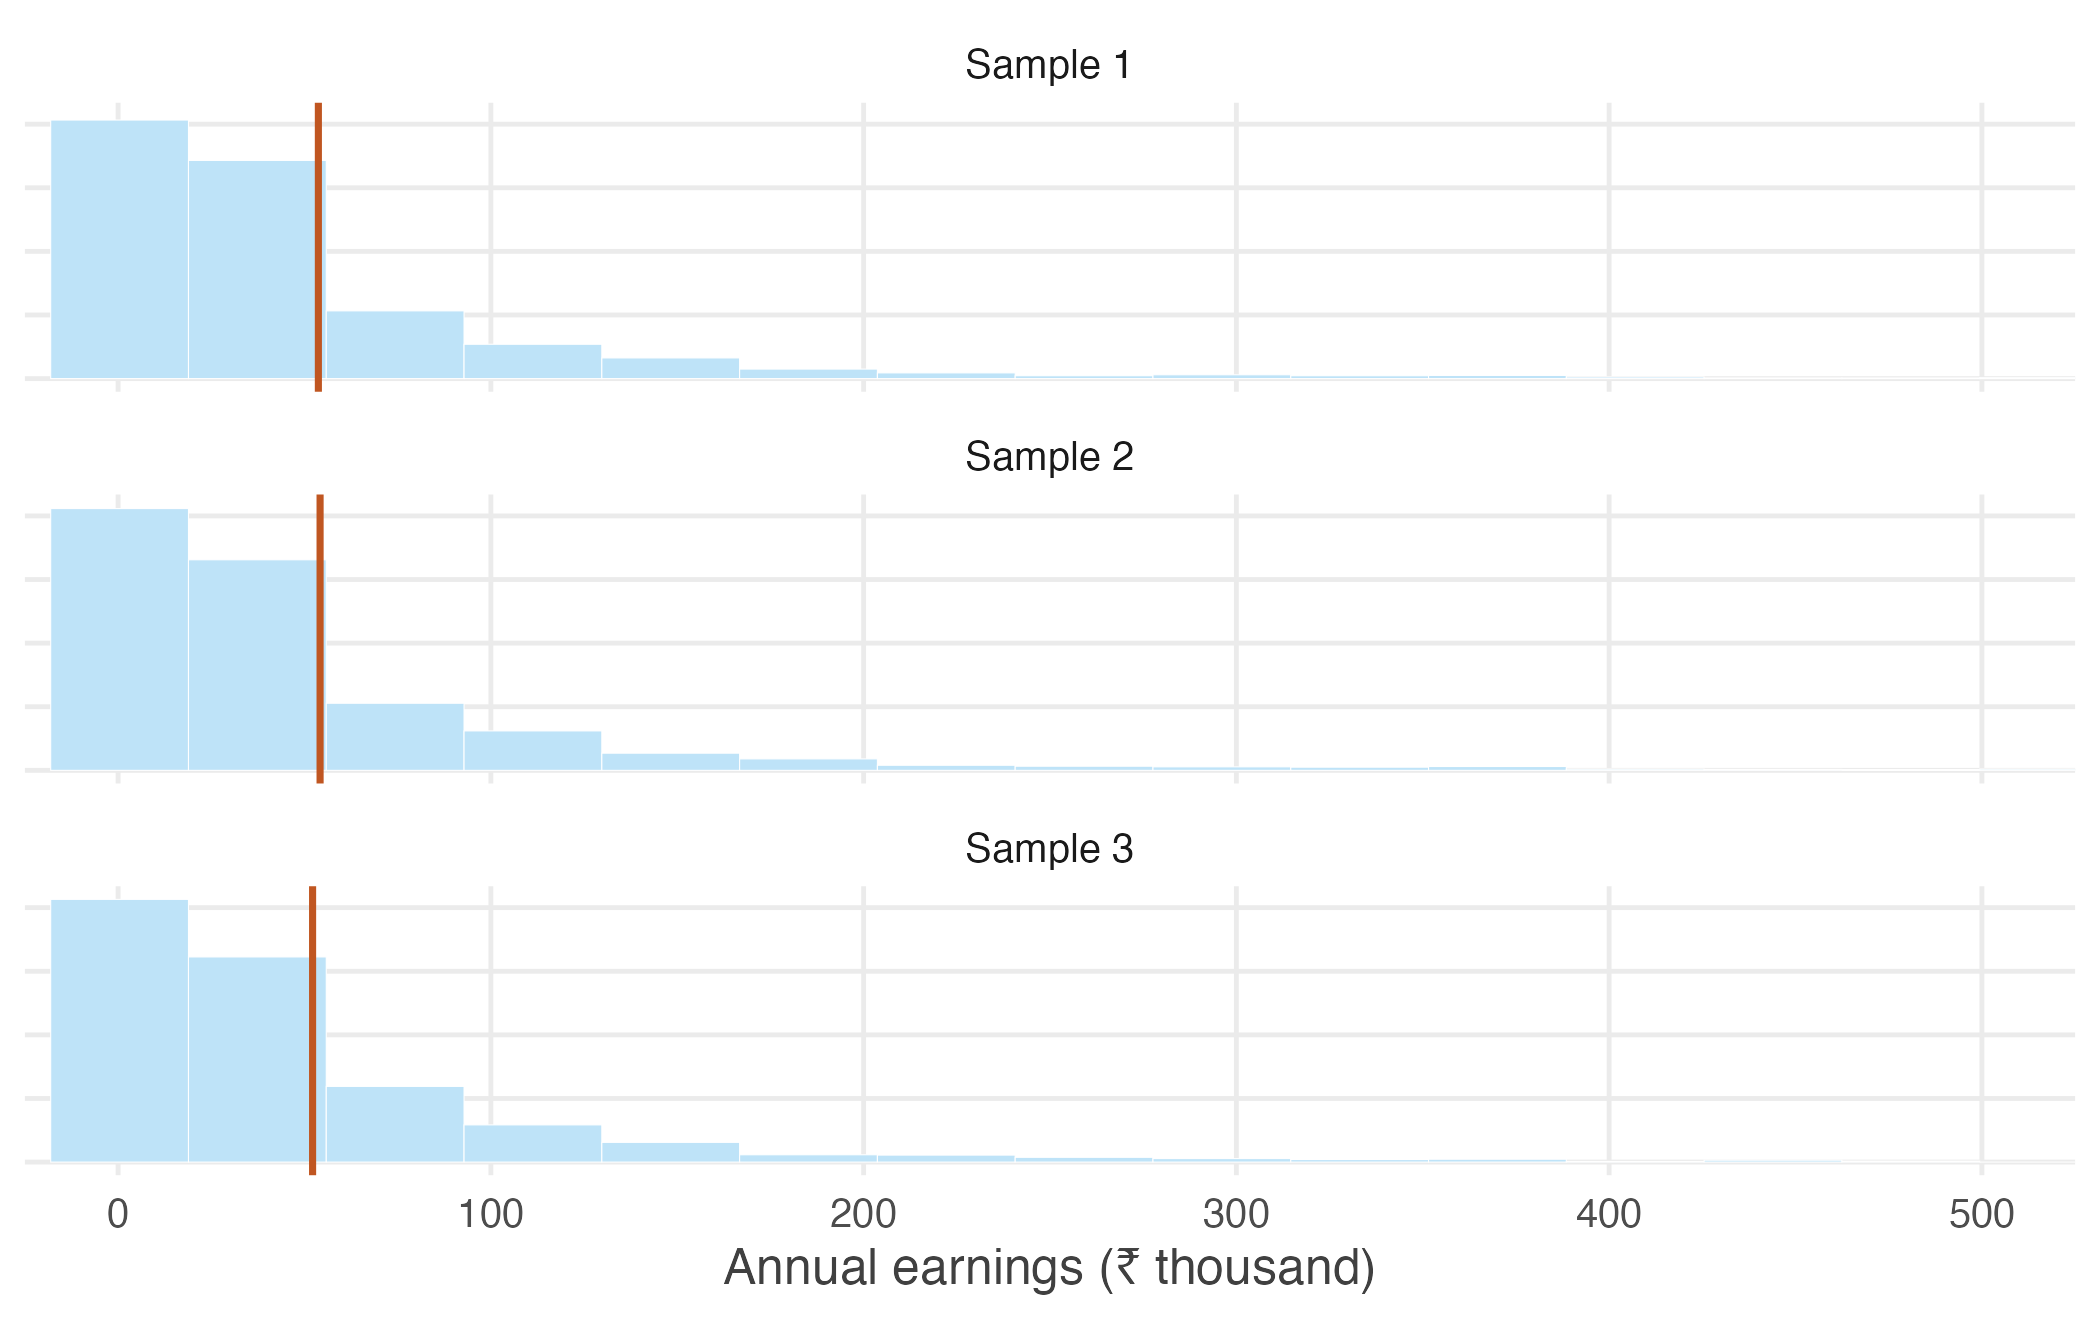
Figure 1.4: Three samples of two thousand workers drawn from the same population.
The three histograms look remarkably similar. Each has the same broad shape: most workers earn relatively little, while a small number earn much more. Nothing suggests that one sample is “better” than another.
Yet the numerical summaries are not identical.
#> sample1 sample2 sample3
#>   53727   54185   52176
Each sample produces a different mean.
The same is true of the median.
#> sample1 sample2 sample3
#>   24974   25238   24599
And of the standard deviation.
#> sample1 sample2 sample3
#>   99376   94857   86327
Every statistic changes because the sample itself has changed. None of the calculations is incorrect, nor has anything gone wrong with the survey. The differences arise simply because different individuals happened to be included.
The exercise above highlights a distinction that lies at the heart of statistical inference. The population is the complete collection of units about which we wish to draw conclusions, while the sample is the subset that we happen to observe. Because different samples contain different observations, the statistics computed from them also differ. This inherent variability is known as sampling variation.
Sampling variation is neither a mistake nor evidence of poor data collection. It is an unavoidable consequence of drawing inferences about a population from a sample. Even when a survey is carefully designed and correctly implemented, a different sample would generally produce different numerical summaries.
This observation also marks the boundary between descriptive and inferential statistics. Descriptive statistics summarises the sample accurately: the sample mean is the mean of the observed data, the sample median is its median, and so on. What descriptive statistics cannot tell us is how closely these sample summaries reflect the corresponding characteristics of the population, or how much they would differ had another sample been drawn.
Inferential statistics addresses precisely these questions. By recognising that the observed sample is only one of many that could have been selected, it provides a framework for assessing the uncertainty associated with sample-based conclusions and for drawing conclusions about the underlying population.